Table of Contents
Understanding Active Harmonic Filter (AHF) Operation
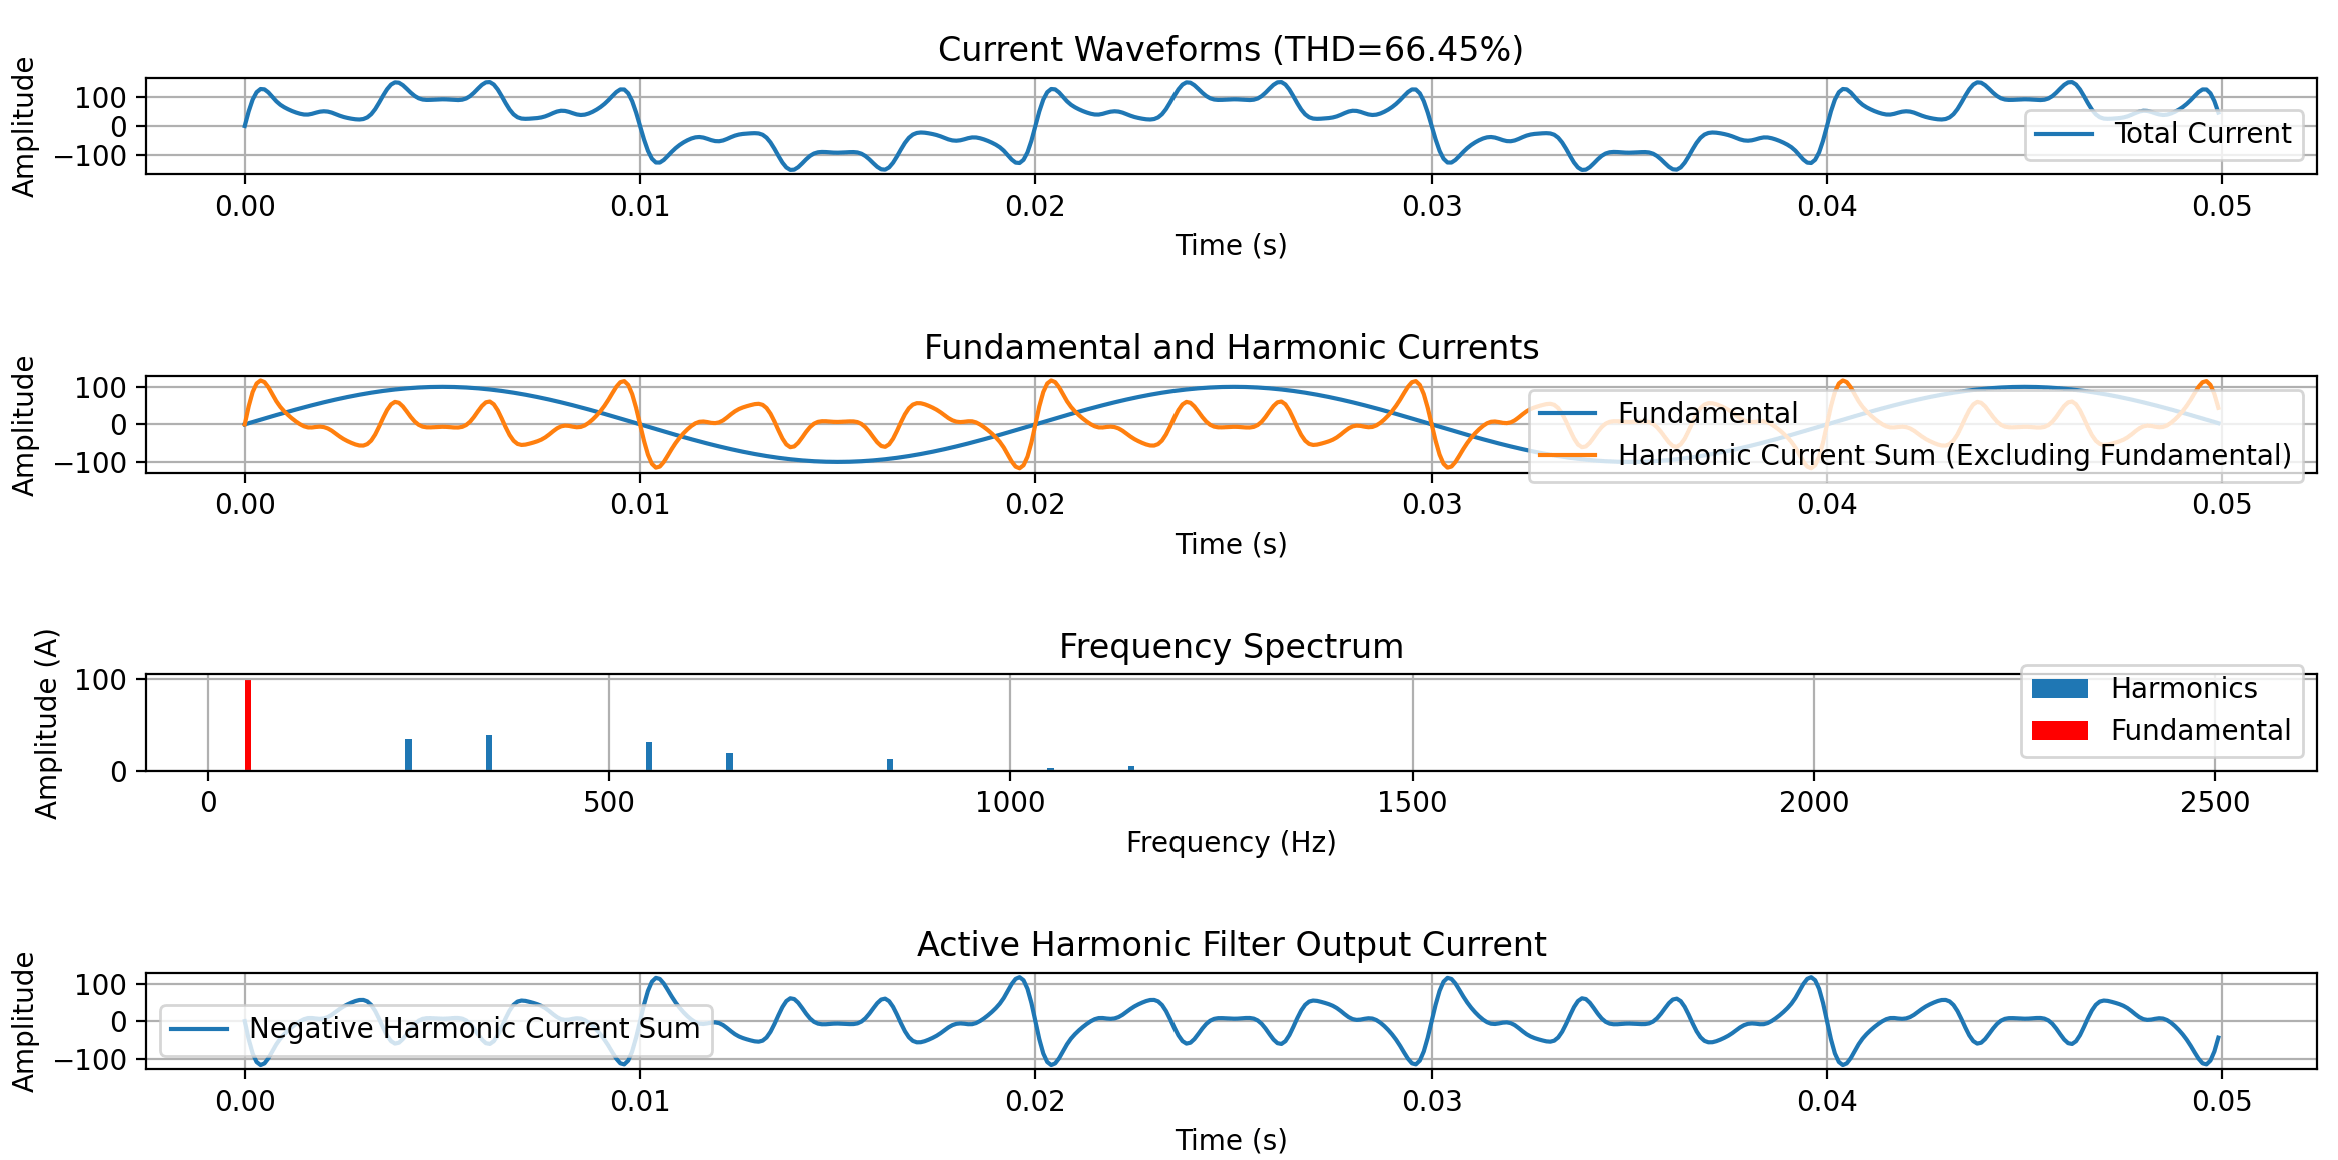
The Python code demonstrates the working principle of an Active Harmonic Filter (AHF), a device used to mitigate harmonic distortions in electrical systems. By analyzing current waveforms and frequency spectra, the code showcases the AHF’s ability to reduce harmonic content and improve power quality.
Code Overview:
- The code reads harmonic parameters from a text file and generates harmonic waveforms.
- It calculates Total Harmonic Distortion (THD) and plots current waveforms, frequency spectra, and AHF output.
- The plots illustrate the reduction of harmonic distortions by the AHF, ensuring smoother current waveforms and improved system performance.
Benefits of AHF:
- Reduces harmonic distortions in electrical systems.
- Improves power quality and system reliability.
- Enhances the efficiency of sensitive equipment.
Active Harmonic Filter (AHF) Python code:
import numpy as np
import matplotlib.pyplot as plt

# Read harmonic parameters from a text file
def read_harmonic_parameters(file_path):
    try:
        with open(file_path, 'r') as file:
            lines = file.readlines()
            harmonic_parameters = [list(map(float, line.strip().split())) for line in lines]
        return harmonic_parameters
    except Exception as e:
        print(f"Error reading harmonic parameters: {e}")
        return None

# Read harmonic parameters
file_path = 'harmonic_parameters.txt'
harmonic_parameters = read_harmonic_parameters(file_path)

if harmonic_parameters:
    # Parse harmonic parameters
    harmonic_multipliers, harmonic_amplitudes = zip(*harmonic_parameters)

    # Initial current parameters
    fundamental_frequency = 50
    display_time = 0.05
    sampling_frequency = 10000
    sampling_points = int(sampling_frequency * display_time)
    time = np.linspace(0, display_time, sampling_points, endpoint=False)
    fundamental_amplitude = 100

    # Convert harmonic multipliers to actual frequency values
    harmonic_frequencies = np.array(harmonic_multipliers) * fundamental_frequency

    # Generate current waveforms for fundamental and harmonics
    fundamental_waveform = fundamental_amplitude * np.sin(2 * np.pi * fundamental_frequency * time)
    harmonic_waveforms = [amp * np.sin(2 * np.pi * freq * time) for freq, amp in zip(harmonic_frequencies, harmonic_amplitudes)]

    # Total current waveform is the sum of fundamental and harmonics
    total_current_waveform = fundamental_waveform + np.sum(harmonic_waveforms, axis=0)

    # Calculate THD
    fundamental_rms = np.sqrt(np.mean(fundamental_waveform**2))
    harmonic_rms_values = [np.sqrt(np.mean(harmonic_waveform**2)) for harmonic_waveform in harmonic_waveforms]
    thd_percent = (np.sqrt(np.sum(np.array(harmonic_rms_values)**2)) / fundamental_rms) * 100

    # Calculate the sum of harmonic currents excluding the fundamental
    harmonic_current_sum = np.sum(harmonic_waveforms, axis=0)

    # Calculate the negative of harmonic current sum
    negative_harmonic_current_sum = -harmonic_current_sum

    # Plot current waveforms and annotate THDi value
    plt.subplot(4, 1, 1)
    plt.plot(time, total_current_waveform, label='Total Current')
    # plt.plot(time, fundamental_waveform, label='Fundamental')

    plt.title(f'Current Waveforms (THD={thd_percent:.2f}%)')
    plt.xlabel('Time (s)')
    plt.ylabel('Amplitude')
    plt.legend()
    plt.grid(True)

    # Plot fundamental and harmonic currents in the second subplot
    plt.subplot(4, 1, 2)
    plt.plot(time, fundamental_waveform, label='Fundamental')
    plt.plot(time, harmonic_current_sum, label='Harmonic Current Sum (Excluding Fundamental)')

    plt.title('Fundamental and Harmonic Currents')
    plt.xlabel('Time (s)')
    plt.ylabel('Amplitude')
    plt.legend()
    plt.grid(True)

    # Plot a bar chart of amplitudes within the frequency range
    plt.subplot(4, 1, 3)
    plt.bar(harmonic_frequencies, harmonic_amplitudes, width=8, align='center', label='Harmonics')
    plt.bar(fundamental_frequency, fundamental_amplitude, width=8, align='center', color='red', label='Fundamental')

    plt.title('Frequency Spectrum')
    plt.xlabel('Frequency (Hz)')
    plt.ylabel('Amplitude (A)')
    plt.legend()
    plt.grid(True)

    # Plot the negative of harmonic current sum
    plt.subplot(4, 1, 4)
    plt.plot(time, negative_harmonic_current_sum, label='Negative Harmonic Current Sum')

    plt.title('Active Harmonic Filter Output Current')
    plt.xlabel('Time (s)')
    plt.ylabel('Amplitude')
    plt.legend()
    plt.grid(True)

    plt.tight_layout()
    plt.show()
else:
    print("Failed to read harmonic parameters from the file.")
Python Running Result